- 3.1 GENERAL APPROACH
- 3.2 PROFILING DELIVERY SYSTEM REFORM INITIATIVES
- 3.3 EVALUATION STRATEGY
- 3.3.1 Level I: The National View
- 3.3.2 Level II: The Demonstration and Cross-Demonstration Perspective
- 3.3.3 Level III: Target Populations and Drivers of Change
- 3.3.4 Level IV: Feedback Reporting
- 4.1 OVERVIEW
- 4.2 APPROACH
- 4.2.1 Literature Search
- 4.2.2 Interviews
- 4.2.3 Survey Instruments
- 4.4.1 Organizational Structure and Service Capacity
- 4.4.2 Governance
- 4.4.3 Financial, Payer, and Reimbursement Model Characteristics
- 4.4.4 Information Technology and Data Management
- 4.4.5 Clinical Process Improvement Capacity
- 4.4.6 Culture, Leadership, and Teamwork
- 4.4.7 Patient Centeredness
- 4.4.8 Local Market Characteristics
- 5.1 INTRODUCTION
- 5.2 APPROACH
- 5.3 DATA AVAILABILITY AND COLLECTION RECOMMENDATIONS
- 5.3.1 Spending
- 5.3.2 Quality
- 5.3.3 Patient Experience
- 5.3.4 Health Outcomes
- 5.3.5 Organization Characteristics
- 5.3.6 Health System Environment
- 5.3.7 Recommendations
- 6.1 OVERVIEW
- 6.2 SPECIFIC DIMENSIONS IN THE ACA INITIATIVE EVALUATION FRAMEWORK
- 6.2.1 Defining a Cross-Initiative View
- 6.2.2 Clear Delineation of the Causal Model
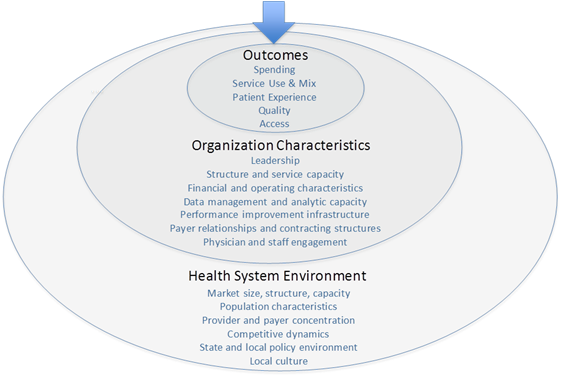
- 6.2.2.1 Outcomes
- 6.2.3.1 Modeling the Collective Effect of Multiple ACA Initiatives
- 6.2.3.2 Hypothesis I: Independency of Interventions
- 6.2.3.3 Hypothesis II: Synergy Between Specific Types of Interventions; or Between all Interventions
- 6.2.3.4 Hypothesis III: Crowding-out Effect of Multiple Interventions
- 7.1 OVERVIEW
- 7.2 COLLECTING BASELINE DATA AND CREATING AN INVENTORY OF ORGANIZATIONAL INFORMATION
- 7.3 MAPPING PROVIDERS TO ORGANIZATIONS
- 7.4 QUALITATIVE CASE STUDIES
- 7.5 ACCOMMODATING OVERLAP
LIST OF EXHIBITS
Chapter 1: Executive Summary
The purpose of this project is to provide the Department of Health and Human Services (HHS) with recommendations for a coordinated evaluation design to tie results from the numerous Medicare, Medicaid and Dual Eligible delivery system reform initiatives and Affordable Care Act (ACA) provisions into an overall model of health system change. These delivery system reform models have the potential to improve quality, reduce costs, and engage patient‑centered care. This project is a first step in an overall planning effort to build the foundation for future evaluations and meta-analyses of many diverse initiatives.
Our work included a review of numerous new programs that would be included in a coordinated evaluation, including:
- Pioneer Accountable Care Organization (ACO)
- Medicare Shared Savings Program
- Bundled Payment for Care Improvement
- State Multi-Payer Primary Care Demonstration
- FQHC Advance Primary Practice Demonstration
- Comprehensive Primary Care Initiative
- State Demonstrations to Integrate Care for Dual Eligible Individuals
- Hospital Value-Based Purchasing
- Medicare Readmission Reduction Initiative
- Community-Based Care Transitions Program
- Partnership for Patients
- Independence at Home Demonstration
This executive summary (Chapter 1) highlights the main findings of this report, summarized by chapter. It incorporates input from a Technical Expert Panel (TEP) that met on June 5 (see Appendix), and is followed by an introduction (Chapter 2) that further describes the objectives of this project. Key chapters of the report are summarized below.
Summary of Chapter 3: Conceptual Analytic Framework
Our approach to a coordinated evaluation design for HHS delivery reform programs began with a conceptual analytic framework. The general approach can be summarized in the following manner:
INT = Interaction Among Interventions
Err = Error Term
This approach aims to measure changes in outcomes that are influenced by the delivery system reform interventions (I) contained in the ACA. The impact of these interventions will vary depending on the characteristics and capabilities of the organizations (O) that participate in these new programs—not only their initial capabilities but also their ability to adapt (∆) their existing processes and methods over time. Observed impacts will also be influenced by the market environments (E) in which the Centers for Medicare & Medicaid Services (CMS) implement each intervention. These environments will also change over time (∆) based on the actions of key actors, including private insurers and state policymakers. Finally, there will be significant interactions (INT) among the interventions to the extent that multiple initiatives take place simultaneously in geographic markets and that specific organizations participate in multiple initiatives.
Our general approach is divided into four general categories: (1) national view, (2) cross-demonstration perspective, (3) target populations, and (4) feedback reporting. First we consider a “main effects” approach that uses national data sets (e.g., claims, encounters or public health data) to look at aggregate trends in spending and outcomes. This approach could compare outcomes between demonstration and non-demonstration areas. Although it would have strong statistical power, the national model would provide limited insight into the role of organizational characteristics on observed changes.
Second we consider the impact of specific combinations of demonstrations. At this level, the analysis can also begin to integrate organizational features to assess the specific drivers of observed effects. Third, we assess the impact of ACA demonstrations on specific target populations. This subgroup analysis is a natural extension of the cross-demonstration work described above. Here we focus on the overall and demonstration specific effects of different ACA activities on specific populations, such as dual-eligible beneficiaries, those with complex chronic illness, or those approaching end of life. Finally, we propose approaches for monitoring outcomes over time to keep policymakers informed and help demonstration sites implement changes more rapidly in response to performance feedback.
Summary of Chapter 4: Organization and Market Variables
This chapter offers recommendations on organization and market variables that are likely to be associated with quality and cost performance for health care organizations participating in delivery reform initiatives. Collection of consistent organizational and market variables across the different HHS delivery reform initiatives may help evaluators distinguish between the impacts of HHS/ACA programs while controlling for the impact of organizational and environmental factors on observed changes in quality and cost performance. It may also help policymakers assess how program impacts vary across different types of organizations. This information may help target future programs toward environments where they are most likely to be successful and to design new programs that may be more effective for certain types of organizations and environments.
Through searches of the peer-reviewed literature, interviews with researchers in the health management field, and syntheses of publicly available organizational surveys, this section presents 53 organizational variables across eight categories:
- Organizational structure and service capacity
- Governance structure
- Financial characteristics
- Information technology and data management
- Clinical process improvement capabilities
- Culture, leadership and teamwork
- Patient centeredness
- Local market characteristics and state policy environment
For each variable, we provide rationale for its inclusion, provide sample wording of a similar survey item, and compare the advantages and disadvantages of each variable. Additionally, we suggest relevant data sources for these variables, including public and private databases, other Federal and state programs (e.g., Electronic Health Records [EHR] Incentive Program, National Committee for Quality Assurance [NCQA] Patient Centered Medical Home Survey and Accreditation), claims, administered organizational surveys, patient satisfaction surveys, as well as qualitative research, case studies, and ethnographies. Finally, the section highlights hurdles in the availability and use of these organizational variables, citing a lack of strong empirical research linking their effect on health outcomes, accommodating variation among the types of organizations, and gathering data on comparison groups.
Summary of Chapter 5: Review of National and Regional Data Sets and Data Collection Recommendations
This analysis of data sets focuses on how they can best support ACA evaluation activities. Fee-for-service claims data are a mainstay for evaluating health reform initiatives, in part because they are national and consistently collected for all beneficiaries over time. However, claims have many limitations, including sparse clinical detail that limits assessment of health outcomes. A variety of methodological issues are also associated with using claims to measure spending, particularly when comparing regions over time. The chapter assesses the benefits of investing in activities like price standardization, improved risk adjustment, and integrating Medicaid and Medicare data because these efforts would enhance the ability to use payment data for monitoring and evaluation activities.
Additionally, the chapter discusses the potential benefits of providing rapid feedback through claims databases and other data collection techniques. There is growing demand from health care providers participating in ACA initiatives to receive timely claims data that would help them track patients as they move through the delivery system, as close to real time as possible. Many hospitals participating in the ACO or bundled payment demonstrations, for example, want to know which patients use institutional care or emergency department services after leaving the hospital. Although institutions are requesting claims data for this purpose, it is less than ideal because of claims lag time. Efforts to better understand the impact of claims lag times are important, but likely insufficient to address the need for a beneficiary tracking system. Initiatives like the Beacon Communities Demonstration, where communities are testing new ways to use health information technology, may offer better solutions. This notion of real time (or virtually real time) data is important to individual sites, but can also support broader evaluation activities, particularly with regard to modeling short-term effects.
Summary of Chapter 6: Framework for Evaluating the ACA Health Reform Initiatives as a Group
This chapter describes a continuum of quantitative methods for a coordinated evaluation plan to quantify the marginal effects associated with individual ACA reforms, designed individually and collectively to encourage improvements in health care delivery that may lead to improved beneficiary outcomes. This is a challenging task since ACA initiatives are complex, target overlapping goals, and take on reform in a dynamic environment with competing or complementary state, local, and private efforts. As a result, a coordinated evaluation of multiple ACA initiatives requires multiple levels of analysis. Specifically, the design needs to consider the effect on populations, organizations and the environment. In addition, we need to ask not only Did an intervention work (enough)? but also Why did it work? This chapter addresses these issues through a multi-level design that begins with main effects and moves on to drill down analyses that consider specific causal pathways and the impacts on specific populations.
At its most basic level, a main effects analysis determines whether there were statistically significant changes in health spending or outcomes within communities, states, and the nation as a whole. It is possible at this level that positive and negative effects are pooled, showing no change. In terms of national priorities, this is important information. The major focus is to propose an approach capable of capturing the effect of multiple interventions on multiple outcomes. In other words, any main effect model has to fulfill the condition of many-to-many causality relations from interventions to outcomes.
Another key objective is to model geographic hot-spots where there is significant reform activity. The initial main effect model can be adapted in response to hypotheses about the potential interactions between distinct reform initiatives. By enhancing the construct, the model can quantitatively consider the synergetic or even competing/contradicting effects of simultaneous interventions taking place within certain organizations or regions. The next step is to extend the modeling effort into sub-regions through either an integrated version of the macro-level main-effect model with fixed or random effects of regions as clusters, or conducting a series of sub-group analyses based on customized replica of the macro level model for individual sub-regions of interest.
Informed by results provided by the main effect models, Chapter 6 also considers the next level of evaluation questions focusing on the organizational or environmental determinants of success or failure, as well as the sustainability of observed effects over different time horizons. The chapter proposes modeling short-, medium-, and long-term effects to better understand the drivers of rapid improvement. Along the same lines, we propose modeling attainment, defined as achieving a significant amount of change, rather than looking only for improvement.
Summary of Chapter 7: Operational Considerations
Chapter 7 focuses on the challenges of aggregating disparate information from government databases and of collecting additional data from providers. Documenting the need for baseline data, especially on organizational characteristics and capabilities, the section emphasizes the need to: (1) prepare a synthesis of organization-related variables that CMS is currently collecting from provider organizations, (2) create a national registry of health care organizations, (3) be judicious in the collection of organizational variables, (4) utilize qualitative research to identify the most critical organizational factors, and (5) move quickly to establish baseline data.
CMS can greatly enhance the field of health services research by helping to map physicians (and their associated claims) to their parent healthcare organization.
Chapter 2: Introduction
With the ongoing implementation of the ACA, HHS is preparing to expand health insurance coverage to 30 million Americans. While this process may be challenging, the approaches for expanding coverage are well understood. HHS is simultaneously examining strategies to control the growth in health spending and improve quality for beneficiaries in federally sponsored health care programs through a series of new initiatives that encourage reforms in the delivery of care. Considerably less is known about the potential impact of these new payment and delivery reform initiatives, and HHS may invest substantial resources to evaluate the effects of these new programs, including the following:
- Pioneer Accountable Care Organization (ACO)
- Medicare Shared Savings Program
- Bundled Payment for Care Improvement
- State Multi-Payer Primary Care Demonstration
- FQHC Advance Primary Practice Demonstration
- Comprehensive Primary Care Initiative
- State Demonstrations to Integrate Care for Dual Eligible Individuals
- Hospital Value-Based Purchasing
- Medicare Readmission Reduction Initiative
- Community-Based Care Transitions Program
- Partnership for Patients
- Independence at Home Demonstration
These programs vary considerably in their scope, size, and target population; evaluating any one requires substantial planning and coordination. Yet, the Assistant Secretary for Planning and Evaluation (ASPE) also needs to consider the collective impact of these initiatives as a group and to anticipate the information that may be needed by HHS several years from now when designing subsequent phases of payment and delivery system reform initiatives. In that light, the primary goals of a coordinated evaluation across all of the HHS delivery reform initiatives are to determine: (1) the collective effect on cost, quality, and access, (2) which interventions (if any) drove the observed effect and should be prioritized for expansion to new geographic areas and populations, (3) whether particular combinations of interventions have a synergistic effect on driving performance improvement, and (4) which types of organizations have performed well under delivery reform initiatives and are therefore most appropriate for targeting future programs or expansions.
Under the guidance of a TEP, this evaluation plan aims to cohesively assess the effects of ACA interventions to inform policy. Specifically, it seeks to evaluate and attribute findings from individual delivery system reform initiatives and synthesize multiple interventions in a coordinated evaluation plan to inform the improvement of overall delivery system reform. After developing a conceptual analytical framework, the report reviews organizational variables and data sources to aid in this effort, and discusses rapid cycle collection efforts to provide timely feedback to both participants and policymakers. Lastly, this report provides recommendations for a coordinated evaluation design, combining quantitative and qualitative analyses, to aggregate and attribute findings from a variety of individual Medicare, Medicaid, and Dual Eligible delivery system reform initiatives.
The report is organized as follows. Chapter 1 provides a summary of each section, highlighting the main points and summarizing key takeaways. This section, Chapter 2, provides an introduction to the project to review overall goals and methodology. Chapter 3 (Task 3) provides the conceptual framework for the analysis plan, outlining methodological approaches and key patient, organizational, and environmental influences in the analysis. Chapter 4 (Task 4) reviews the health care management literature and suggests nearly 50 organizational variables and their potential data sources. Chapter 5 (Task 5) reviews existing data sources and availability. The purpose of Chapter 6 (Task 6) is to identify, examine, and recommend methods for a coordinated evaluation plan to assess the extent to which ACA reforms improve overall health system delivery. Chapter 7 (Task 7) outlines operational considerations with respect to data collection and analyses that may substantially affect the implementation of the recommendations from the previous tasks. Finally, the appendix summarizes key points from the TEP meeting on June 5, 2012, and provides a list of the acronyms used in this report.
Chapter 3: Conceptual Analytic Framework
Developing recommendations for an approach to a coordinated evaluation design for HHS delivery reform programs begins with a conceptual analytic framework. Our analytic framework is divided into three principal sections: (1) general approach, (2) profiling delivery system reform initiatives, and (3) program evaluation strategy.
3.1 GENERAL APPROACH
Our general approach to this project evolves from the schematic presented in Exhibit 3-1 and can be summarized in the following manner:
INT = Interaction Among Interventions
Err = Error Term
Essentially, this approach aims to measure changes in outcomes that are influenced by the delivery system reform interventions (I) contained in ACA. The impact of these interventions may vary depending on the characteristics and capabilities of the organizations (O) that participate in these new programs—not only their initial capabilities but also their ability to adapt (∆) their existing processes and methods over time. Observed impacts will also be influenced by the market environments (E) in which CMS implements each intervention. These environments will also change over time (∆) based on the actions of key actors, including private insurers and state policymakers. Finally, there will be significant interactions (INT) among the interventions to the extent that multiple initiatives take place simultaneously in geographic markets and that specific organizations participate in multiple initiatives.
Therefore, the challenge of this project is to: (1) identify a consistent series of variables that meaningfully describe the organizational, market and policy conditions and dynamics that will affect the outcomes of the ACA’s delivery reform initiatives, (2) present an approach for collecting these data, (3) assess the likely interactions among the ACA initiatives, and (4) prepare coordinated evaluation design recommendations based on these analyses.
Our primary approach to developing organizational and market variables, identifying viable data sources, assessing interactions, and developing coordinated recommendations is a combination of literature and document review, expert interviews, and consultation with a technical expert panel. The guidelines for this project required that we conduct our analysis using publicly available information. Although we interviewed some CMS staff as part of this project, the interviews were limited to programs where CMS had already awarded evaluation contracts. While we reviewed publicly available request for proposals for new CMS evaluations, we did not have access to materials for any awarded contracts.
3.2 PROFILING DELIVERY SYSTEM REFORM INITIATIVES
In moving from a conceptual framework to recommendations for a coordinated evaluation design, it was important to develop a clear understanding of the scope and nature of the new HHS delivery reform initiatives. We began by developing a delivery reform map that identified elements that were likely to influence the evaluation process across the different programs (see Exhibit 3-2). However, such a map is only a snapshot. During the course of this project, CMS announced a number of new program awards and many more details about the programs. We have updated these profiles throughout the project, but they are necessarily incomplete because of the dynamic nature of CMS program awards. Details of these profiles can be found in Appendix A and allows us to make a number of observations.
- Providers — A vast majority of the new delivery reform programs involve hospitals as the primary participant or as a core participant in a broader delivery network. Hospitals are the primary participants for the bundled payment pilot, hospital value-based purchasing, readmission reduction, and partnership for patients. Hospitals are likely to be central participants in the ACO and community care transitions program. Many hospitals may also be involved in state Patient-Centered Medical Home (PCMH) programs through their ownership of primary care practices.
- Indirect impacts — Providers that are not directly involved in the new programs may nonetheless be significantly affected. For example, improving coordination of post-acute care and reducing unnecessary spending in post-acute settings will be a major focus of the bundled payment program. PCMH programs will have a major objective of reducing potentially avoidable hospital admissions and readmissions.
- Geography — Many ACA delivery reform programs are national in scope, but as voluntary programs, are likely to be concentrated in regions with certain characteristics—either those with high costs (i.e., significant opportunity for providers to achieve savings) or areas with high provider readiness (i.e., groups experienced with managed care). Once participants in the projects are announced, we expect it may lead to “hotspots” of activity. A key question is whether more detailed evaluations of hotspots may provide better information for policymakers than a broad evaluation across all geographies.
- Project size/scope — Programs like Medicare Shared Savings that cover millions of beneficiaries and tens of billions of Medicare payments will have greater impacts on aggregate outcomes. However, small programs, like Independence at Home, may have large impacts relative to their size. The evaluation methodology will have to consider such size and scope differences.
- Timing — Most of the programs for evaluation may begin in 2012 and 2013 and continue for 3 to 5 years. Some of the programs (i.e., Multipurpose Senior Services Program [MSSP]) are permanent and will continue beyond their initial contract period. Other programs (e.g., PCMH) extend and expand state programs that were in existence prior to the ACA. It is also important to consider the time that providers will require to ramp up their capabilities to perform successfully in these programs. This implies that the strongest effects of these programs may well occur beyond their original program period.
- Beneficiary type — While some programs are focused on discrete groups of Medicare beneficiaries (frail elderly, dual-eligibles, and those with multiple chronic conditions) others cover Medicare beneficiaries more generally. Nevertheless, even in broader programs like MSSP, organizations will focus resources on managing the most frail, complex, and high-risk patients. Their success in so doing may be important for achieving improvements in more aggregate outcome measures.
Participating Providers
Medicare Shared Savings
Regular, Pioneer
Advanced Pmt.
1. Integrated Delivery Systems
2. Multi-specialty groups
Bundled Payment
Hospital VBP
Readmission Reduction
1. Hospitals (in bottom quartile)
State Dual Eligible
NA – but probably full range of providers
State PCMH
1. PCP practices
2. Multi-spec practices
3. Hospital clinics
Partnership for Patients
1. Hospitals & and hospital systems (large systems)
Community Care Transitions
1. Partnerships between hospitals and community based organization, CBOs)
Independence at Home
NA – Range of providers able to deliver home based primary care. (Probably hospitals in partnerships with others).
Impacts
Direct
Indirect
Medicare Shared Savings
Regular, Pioneer
Advanced Pmt.
Integrated delivery systems
Hospitals; Medical specialists; Post-acute care providers
Bundled Payment
Non-affiliated physicians; Post-acute care providers
Hospital VBP
Readmission Reduction
Post-acute care providers; Primary care providers
State Dual Eligible
Integrated delivery systems
State PCMH
Primary care delivery systems
Hospitals, post-acute care providers, specialists, ancillary service providers
Partnership for Patients
Hospitals and hospital systems
Community Care Transitions
Hospital and community based organization partnerships
Non-participating hospitals, post-acute care providers.
Independence at Home
Physicians and care-coordination partners
Hospitals, post-acute care providers.
Geography
Medicare Shared Savings
Regular, Pioneer
Advanced Pmt.
National – need award data to determine geographic concentrations
Bundled Payment
National – need award data to determine geographic concentrations
Hospital VBP
National – All hospitals
Readmission Reduction
National – 25 percent of hospitals
State Dual Eligible
15 $1M design contracts to states. Hope over time to enroll as many as 25 states.
State PCMH
Statewide: MI, MN, VT Selected Areas: ME, NY, PA, NC, RI
Partnership for Patients
National – likely concentration based on hospital system location
Community Care Transitions
National – Concentrated in communities with appropriate partnerships
Independence at Home
National - Physician practices across the country
Timing
Medicare Shared Savings
Regular, Pioneer
Advanced Pmt.
January 1, 2012 to January 1, 2015 with options to January 1, 2017
Initial contracts 3 years with 2 options
Program duration = permanent
Bundled Payment
January 1, 2013 – January 1, 2016
Hospital VBP
2013 (1 percent withhold) to 2017 (2 percent withhold)– permanent
Readmission Reduction
2013 (1 percent) – 2014 (2 percent) – 2015 (3 percent) and beyond
State Dual Eligible
Target enrollment date of 1/1/2013 for 3-year program
State PCMH
3-year program. VT/NY/RI: 2011–13; NC/MN 2012–12; ME/ME/PA 2013–15
Partnership for Patients
Starting 1/1/12 - 2 years + one option period
Community Care Transitions
Start in 2012. Applications accepted on a rolling basis.
Independence at Home
Start 2012 and operates for 3 years
Scope/Size
Medicare Shared Savings
Regular, Pioneer
Advanced Pmt.
Total dollars for attributed beneficiaries x number of ACOs x beneficiaries per ACO.
30 Pioneer @30,000 members + 100 ACO @ 15,000 members (@10,000/member) = $22.5 billion/yr
Bundled Payment
Average value of selected bundles x number of hospitals x 2-5 episodes/5-25 DRGs x 300 hospitals = Total dollars
Hospital VBP
2 percent of DRG by 2017 x all hospitals = max payout is a percent of DRG
Readmission Reduction
3 percent of DRG x 25% of hospitals
State Dual Eligible
Design contracts awarded to 15 states. Number of beneficiaries will depend on final state proposals and awards (forthcoming). CMS goal of targeting up to 2 million duals.
State PCMH
8 states. States estimate approximately 1,200 PCP practices and 1 million Beneficiaries.
CMS estimates maximum of 700K – 800K beneficiaries.
Partnership for Patients
$218 million – improvement support grants, not ‘patient revenue.’ Awards to 26 “Hospital Engagement Networks” that according to CMS encompass 80 percent of total Medicare discharges.
Community Care Transitions
Participants enrolled on a rolling basis. Currently have 7 awarded sites. Will continue to award sites until reaching the funding ceiling ($500M paid based on a “per-eligible discharge rate” to participating sites). Anticipate awarding around 70 partnerships (with around 350 hospitals),
Independence at Home
Limited to 10,000 beneficiaries
Beneficiary Characteristics
Medicare Shared Savings
Regular, Pioneer
Advanced Pmt.
Population based – all beneficiaries in target areas
Bundled Payment
Beneficiaries with target admissions (defined by DRG) at target hospitals
Hospital VBP
All beneficiaries with a hospital admission.
Readmission Reduction
Beneficiaries with a hospital admission
State Dual Eligible
Dual eligible beneficiaries in target states
State PCMH
Beneficiaries who receive care from a participating practice
Partnership for Patients
Beneficiaries with a hospitalization who are at risk for adverse outcomes
Community Care Transitions
High risk beneficiaries with a hospitalization
Independence at Home
Community based high need populations
3.3 EVALUATION STRATEGY
Our general approach to evaluation is divided into four general categories: (1) national view, (2) cross-demonstration perspective, (3) target populations, and (4) feedback reporting.
3.3.1 Level I: The National View
Our evaluation strategy will consider the impact of ACA demonstrations at multiple levels. As national legislation, our initial question is whether the demonstrations as a group have an observable impact on cost, quality, and access. This is a main effects analysis that assumes some theoretical coherence across all demonstrations. It is probably fair to characterize the theoretical underpinning of the ACA as a series of efforts to use changes in incentives—combined with expanded data availability and targeted technical assistance—to drive changes in delivery systems and ultimately the practice/culture of medicine. This means that an overall evaluation of ACA demonstrations needs to consider sustained changes in the practice of medicine in addition to observable changes in cost, quality, and access.
The basic analytic approach will involve the use of national data (e.g., claims, encounters, or public health data) to look at national trends. It may also be possible to compare outcomes between demonstration and non-demonstration areas. Changes in the delivery of care may be captured in claims (e.g., service delivery patterns), and though assessment of organizational changes in health care organizations participating in these programs that must be captured through surveys and qualitative data (e.g., site visits).
This main effects level needs to consider the impact on individuals and populations, as well as the impact on organizations. This is best done using mixed methods designs that integrate quantitative and qualitative analysis in a systematic way.
3.3.2 Level II: The Demonstration and Cross-Demonstration Perspective
One level down, we will consider the impact of individual demonstrations or specific combinations of demonstrations. Here, we will recommend that HHS look much more closely at specific evaluation designs for areas of congruence. Although we do not have access to the evaluation designs currently under development for these new programs, we would recommend that HHS abstract study designs for each demonstration to understand the use of experimental, quasi-experimental, and observational approaches. It will also be important to map primary and secondary outcomes. Efforts with similar outcomes or designs may lend themselves to quantitative comparisons like meta-analysis or pooling data. Results from demonstrations focused on readmissions reductions as an outcome, for example, could be combined to understand the complete range of effect sizes, rather than a simple national average.
At level II, the analysis can also begin to integrate organizational features to assess the specific drivers of observed effects. This presents a number of challenges, including limited measure of organizational and contextual factors, limited availability of organizational data nationally (not just in treatment areas), multiple treatment models within a given demonstration, and overlapping interventions within a given market area.
Untangling this complexity will require a detailed understanding of the context, organizational capacity, and hypothesized or desired change process (e.g., changes in financial incentives leading to changes in care coordination intended to reduce readmissions). Armed with this information, it then becomes possible to develop heuristic models that can be tested empirically or intervention typologies that become inputs into a dynamic modeling process.
At this stage, it is important to be aware of policy priorities and the ultimate goals of the evaluation. Narrowly focusing on program models, for example, may miss the broader capacity of organizational changes to support the ability to improve performance, mange financial risk, or administer new programs.
3.3.3 Level III: Target Populations and Drivers of Change
Finally, we will consider the impact of ACA demonstrations on specific target populations. This subgroup analysis is a natural extension of the cross-demonstration or cross-site work described above. Here we will focus on the overall and demonstration-specific effects of different ACA activities on specific populations, such as dual-eligibles, those with complex chronic illness, or those approaching end of life. The goal is to drill down and better understand which interventions are effective for which population subgroups. Given geographic and program design diversity, it will once again be important to consider the role of delivery system and contextual factors on population outcomes. For example, Does HMO penetration have an impact on the design and outcomes of state dual eligible demonstrations?
3.3.4 Level IV: Feedback Reporting
In addition to overlapping geographically, ACA demonstrations also have complex timing issues. Programs start at different times and many are likely to have different timelines before achieving a maximal effect. Monitoring outcomes over time has two potential benefits. In addition to keeping implementation staff and policymakers informed, demonstration sites themselves will benefit from understanding the changes in outcomes over time.
There are a number of challenges associated with doing this well. For example, claims-based measures face claims maturity issues—payment systems were not designed for surveillance and monitoring, so it is important to understand the type of ‘noise’ introduced by billing processes. Quantifying the billing bias may allow for the calculation of measures using younger data. It will also be important to provide demonstration participants with intermediate outcomes, such as information collected from site visits or consumer surveys. Market research may provide valuable clues about how small sample information can be used to inform decisionmaking.
Chapter 4: Organization and Market Variable Recommendations
4.1 OVERVIEW
In this chapter, we offer recommendations on organization and market variables that we believe are likely to be associated with quality and cost performance for health care organizations participating in HHS delivery reform initiatives including those created by the ACA. The overall goal of this project is to provide recommendations for a coordinated evaluation design that would tie results from the numerous Medicare, Medicaid and Dual Eligible delivery system reform initiatives and ACA provisions into an overall model of health system change.
The impact of the new interventions may vary depending on the characteristics and capabilities of the organizations that participate in these initiatives—not only their initial capabilities but also their ability to adapt processes and methods over time. The market environments in which CMS implements each intervention may also influence observed changes in quality and cost performance and these environments may also change over time based on the actions of key actors, including private insurers and state policymakers.
Collection of consistent organizational and market variables across the different HHS delivery reform initiatives will help evaluators distinguish between the impacts of the HHS/ACA programs while controlling for the impact of organization and environmental factors on observed changes in quality and cost performance. It may also help policymakers assess how program impacts vary across different types of organizations. This information may be helpful in targeting future programs towards environments where they are most likely to be successful and to designing new programs that may be more effective for certain types of organizations and environments with below average performance.
4.2 APPROACH
Our approach to developing organizational and market variable recommendations included the following steps. First we performed a literature search. Next, we reviewed a range of organizational survey instruments that have been used across a variety of studies. We reviewed several organizational readiness assessments that were provided to us by private organizations on the condition that we only use them as background information. We also interviewed individuals involved in health care organization survey research as well as health system executives (identified below) to obtain feedback about the types of variables they believe are most important for performance on cost and quality outcomes.
4.2.1 Literature Search
A full meta-analysis of the literature is beyond the scope of this project. But to gain an understanding of the field’s breadth, key articles, and key academics, we conducted a search within the Information Sciences Institute (ISI) Web of Science under the term health care organization for the years 2000-2012 (n>16,300 articles). We further limited the results to the sub-categories of health care science services and health policy services (n=3,892 articles) to define the discipline of health care management and organization. We examined the articles in this set that were most cited and explored the methods by which they collected their data, including national surveys. We also documented the most frequent authors, which we utilized to determine key informants to interview.
The literature review showed that the discipline is rife with attempts to implement novel health care interventions, many with only modest or partial success. In many cases, the lack of adoption success stems from a failure of cultural or organizational receptiveness, rather than a shortcoming of the technical aspects of the intervention itself (Berwick, 2003; Rogers, 1995). Attention must be paid to how individual, group/team, organization, and larger environment/system level variables affect reform efforts (Ferlie & Shortell, 2001), and how these factors relate to the specific characteristics of the intervention (Grol & Grimshaw, 2003).
The literature provides some guidance on market variables that are associated with quality and cost performance. Many analyses employ organizational variables as a control (e.g., organizational size or academic affiliation), but don’t explicitly emphasize these components. Others specifically examine how managerial and market forces affect health care. While enumerating all of these studies would be too cumbersome to include here, some well-known examples include:
- Successful implementation of quality improvement efforts is dependent on culture and leadership of the organization (Shortell et al., 1995; Weiner, Shortell, & Alexander, 1997)
- Health outcomes are strongly related to the volume of activity in an organization in which enhanced organizational experience, learning curves, and focused routines lead to centers of excellence across many disease conditions (e.g., Birkmeyer et al., 2005 in cancer; Nguyen et al., 2004 in bariatric surgery).
- Provider capacity affects spending levels (i.e., higher relative supply of hospitals and specialist physicians is associated with higher spending in geographic markets; higher relative supply of primary care physicians is associated with lower spending; The Dartmouth Atlas Group)
- Health Maintenance Organization (HMO) penetration was significantly associated with lower hospital and Medicare costs in the 1990s (numerous articles).
- Health costs and quality can vary substantially between for-profit and not-for-profit hospitals (Jha et al., 2005), nursing homes (Harrington et al., 2001), or insurers (Himmelstein et al., 1999).
Yet for all these papers, the use of organizational and market variables to explain observations about health care performance has been haphazard. Much of this literature simply documents the presence of technology or processes in organizations that are thought to contribute to improved performance on spending and quality, but does not tie these variables to actual performance (e.g., Casalino et al., 2003). Alternatively, when research has documented superior performance for certain types of organizations, it is reported as a statistical association with coarse metrics of overall organizational size or structure rather than the impact of discrete organizational characteristics (e.g., Weeks et al., 2010).
Very few researchers have put these perspectives together, seeking to determine not just ‘what works,’ but to understand ‘what works and why’ (Damshroeder et al., 2009). Some researchers are actively exploring this connection. For example, the U.S. Department of Veterans Affairs Quality Enhancement Research Initiative (QUERI) has begun incorporating organizational factors into their research plans. They emphasize the importance of understanding how organizational structure and processes can affect the ability to identify and implement best practices (Yano, 2008). However, these efforts are still in the early stages.
4.2.2 Interviews
We interviewed several prominent health services researchers to discuss how organizational and market variables are likely to influence health care outcomes and potential approaches to collecting this information. We spoke with the following individuals; their rank as the most frequent U.S.-based authors in the health care organization and management discipline is indicated in parentheses.
- Stephen Shortell, PhD., University of California, Berkeley (#1)
- Constance Horgan, PhD, (#5), Dominic Hodgkin PhD, (#6), Elizabeth Merrick PhD, (#7), Brandeis University (joint interview)
- Lawrence Casalino , MD, PhD, Weill Cornell University Medical College (#17)
- Sara Singer, PhD, MBA, Harvard School of Public Health (>#50)
We also interviewed several health care executives to ensure that these theories and approaches were meaningful to real-world decisionmakers.
- Francis J Crosson, MD, former Executive Director of The Permanente Federation and Senior Fellow, Kaiser-Permanente Institute for Health Policy
- Thomas Graf, MD, Chairman, Community Practice Service Line, Geisinger Health System
- Dana Safran, ScD, Senior Vice President. Performance Measurement & Improvement, Blue Cross/Blue Shield of Massachusetts
4.2.3 Survey Instruments
Lastly, we reviewed a range of survey instruments that health services research have developed to evaluate health care organizations. We focused on publicly available (or soon-to-be) surveys, which provide examples of how organizational variables have been systematically collected across multiple health care entities.
- National Study of Physician Organizations and the Management of Chronic Illness (NSPO I), Stephen M. Shortell et al., School of Public Health, University of California-Berkeley, 2000-2001.
- Competing Values Framework (CVF),developed for healthcare by Stephen Shortell et al., RAND Improving Chronic Illness Care Evaluation; adapted by the Veterans Health Administration. Source: 2004 VHA All Employee Survey.
- A National Survey of Health Record Keeping among Physicians & Group Practices in the United States, Catherine DesRoches et al., Institute for Health Policy, Massachusetts General Hospital, 2008.
- Community Tracking Study, Survey of Physicians, Center for Studying Health Systems Change, 2008.
- Learning Organization Survey, David A. Garvin, Amy C. Edmondson, and Francesca Gino, Harvard Business School, 2008.
- Use of Electronic Health Records in U.S. Hospitals, Ashish Jha et al., Department of Health Policy and Management, Harvard School of Public Health, 2009.
- National Study of Small and Medium-Sized Physician Practices (NSSMPP), Lawrence Casalino, Weill Medical College, Cornell University, 2009.
- 2009 Commonwealth Fund National Survey of Federally Qualified Health Centers, Commonwealth Fund – HarrisInteractive, 2009.
- 2010 AHA Annual Survey, American Hospital Association, 2010.
- Survey of Risk-Based Contracting and Physician Compensation in Organized Delivery Systems, Robert Mechanic and Darren Zinner, Heller School for Social Policy and Management, Brandeis University, 2011.
- Medical Group Compensation and Financial Survey, American Medical Group Association, 2012.
- Relational Coordination Survey, Jody Hoffer Gittel, Heller School for Social Policy and Management, Brandeis University.
- Health Systems Integration Study Questionnaire, Robin Gilles et al., Northwestern University, 1996.
- National Survey of Physician Organizations III (NSPO III), Stephen M. Shortell et al., School of Public Health, University of California-Berkeley, 2012 (DRAFT).
The literature review, interviews, and surveys described above are used as the foundation for our organization and market variable recommendations.
4.3 TAXONOMY OF PROVIDERS
New HHS delivery reform initiatives will directly or indirectly influence a full range of health care providers and organizations. Exhibit 4-1 provides context for setting priorities about the types of providers and related organizational variables. This exhibit illustrates that the delivery reform initiatives target a wide range of provider categories, but that the majority of programs are focused on improving cost and quality performance across a continuum of care rather than for specific categories of service (e.g., hospital quality only). For example, in Model 2 of the CMS bundled payment program, applicants will be financially responsible for episodes of care that begin with admission to the hospital and include 30–180 days of post-acute care services. Since, the majority of spending for many DRG-based episodes occurs in the post-acute care setting (RTI International, 2011), participants in this program (many of which are hospitals) will have to establish new systems for coordinating services outside of the hospital.
In keeping with the HHS focus on care coordination across the continuum, we began our assessment of organizational variables with a focus on integrated delivery systems, multi-specialty physician groups, and contracting entities like physician-hospital organizations that can take responsibility for managing patient populations. We recognize that a wide range of organizations (hospitals, physician groups, post-acute care providers etc.) will participate in these programs. However, specifying organizational variables for each type of provider is not possible within our charge of developing 25–40 variable recommendations.
We recognize that evaluators will frequently want to collect additional information from individual providers (e.g., hospitals) within integrated networks. Many participants in the HHS delivery reform programs are not integrated providers. But the ability of freestanding providers to successfully improve coordination across the continuum of care will depend on the nature of their contractual and informal relationships with other components of the delivery system. Therefore, although we have concentrated our recommended variables on physician-centered integrated delivery systems, many of the variables we propose can be adapted for freestanding providers.
Program
Focus of Performance Improvement
Primary Provider Organizations Targeted in Program
Shared Savings and Pioneer ACO
Continuum of Care
Integrated Delivery Systems (IDN)
Multi-specialty physician groups
(Physician-hospital organizations, independent practice associations)
Bundled Payment
Continuum of Care
Hospitals, PHOs, IDNs,
Post-Acute Care Providers
Hospital Value-Based Purchasing (VBP)
Hospital care expanding to continuum of care
Readmission Reduction
Continuum of Care
Hospitals (in bottom quartile)
State Dual Eligible
Continuum of Care
Range of provider organizations depending on state program.
Multi-payer Advanced Primary Care Practice Demonstration
Continuum of Care
Primary care physician practices
FQHC Advanced Primary Care Practice Demo.
Continuum of Care
Federally Qualified Health Centers
Partnership for Patients
Hospitals and hospital systems
Community-Based Care Transitions
Continuum of Care
Hospitals working with community based organizations (CBOs)
Independence at Home
Continuum of Care
Range of providers able to deliver home based primary care. (Likely hospitals in partnerships with others).
4.4 ORGANIZATIONAL AND MARKET VARIABLE RECOMMENDATIONS
We have developed a taxonomy in which the organizational and market variable recommendations are divided into eight categories. This section offers a brief discussion of each category. Detailed recommendations are provided in Exhibit 4-2 where for each item, we provide a definition and an example of how a data request might be worded, drawn from existing surveys or the literature. The rationale for selecting individual variables is provided in Exhibit 4-3. Principal advantages and disadvantages are listed in Exhibit 4-4. We have chosen the following categories to organize our variable recommendations.
- Organizational structure and service capacity
- Governance structure
- Financial characteristics
- Information technology and data management
- Clinical process improvement capabilities
- Culture, leadership and teamwork
- Patient centeredness
- Local market characteristics and state policy environment
4.4.1 Organizational Structure and Service Capacity
General organizational variables are needed to characterize the organizations participating in the various HHS delivery reform programs. This includes the type of organization, size, and composition of providers, services, and health care personnel. Size variables may affect program implementation efforts by allowing organizations to more easily absorb new overhead expenses (e.g., new personnel, administration, and coordination programs) across the organization. The scope of an organization and its ability to control or integrate services across the continuum of care may improve groups’ ability to manage care transitions. An important aspect of organizations is the degree of integration and alignment with physicians. Therefore variables that indicate the model of physician affiliation with the organization and methods of compensating physicians are critical.
4.4.2 Governance
The organization’s ownership model (public, non-for-profit, for-profit) may influence the level and nature of investments that organizations are willing and able to direct towards delivery reform initiatives as well as the priority they place on achieving certain outcomes. The composition of the board and the level of participation by different stakeholders (physicians, managers, community members, patients) will influence the willingness of organizations to try and implement changes.
4.4.3 Financial, Payer, and Reimbursement Model Characteristics
The payer mix and reimbursement contracts of health care organizations are an indicator of their experience with managed care and alternative (non-fee-for-service) reimbursement models, experience that may influence their performance under HHS delivery reform programs. Understanding each organization’s market share is also important, as a dominant market share may lead to an emphasis on revenue enhancement through private insurer price negotiation rather than reducing the cost of delivering medical services. Finally, organizational profitability and capital reserves are an indication of resources available to invest in the infrastructure necessary for improving delivery system performance.
4.4.4 Information Technology and Data Management
One common attribute of successful delivery systems is their ability to use clinical and financial data to measure performance, standardize processes, and increase the quality, efficiency, and reliability of care through timely feedback of information to clinicians, managers, and patients. To improve care delivery, an organization must first have a strong understanding of its baseline processes and outcomes. Under the axiom, you manage what you measure, health information technology allows an organization to develop reports on the care of specific providers, clinics, or groups, and for individual patients or subsets of clinically-relevant patients (i.e., a patient registry). With this data, organizations can identify areas of high variance, implement programs to standardize care processes based on clinical evidence, and develop programs and incentives to reward quality, efficiency, and patient-centeredness. This category of variables includes information about the existence of infrastructure, like electronic medical records, enterprise-wide data repositories, and analytic software tools. More importantly it will include variables that measure the functionality of these tools, including discrete categories of clinical decision support.
4.4.5 Clinical Process Improvement Capacity
This category of variables examines the formal commitment of organizations to a management method for achieving improved performance. It is designed to capture specific investments in technologies, processes, and personnel to increase quality, support high-risk patients, and improve handoffs and care transitions.
4.4.6 Culture, Leadership, and Teamwork
New HHS initiatives require improved coordination across settings—whether among divisions of an organization or across external health care partners. Doing so effectively will require effective work processes and provider relationships. The success of organizations in these pilots may depend upon how well the leadership and frontline workers within organizations can adapt. To that end, we have included several variables on organizational culture and leadership, seeking to examine whether the organization emphasizes a supportive learning environment and has established modes of working that allow for experimentation and analysis of those experiments. In short, we seek to measure the extent to which these groups are learning organizations.
4.4.7 Patient Centeredness
New HHS delivery reform programs have emphasized the need for patient-centered care. Therefore, we have recommended several variables that indicate organizational efforts to give patients better access to information and engage them in shared decisionmaking. These reflect desired attributes of the patient-centered medical home.
4.4.8 Local Market Characteristics
Organizational performance on Medicare and Medicaid initiatives will be influenced by local market factors that either reinforce or confound the incentives and objectives of the HHS delivery reform programs. The three principal factors in this category are provider market conditions, insurer market conditions, and state policy environment. We expect provider consolidation in local markets to have an inverse relationship to the rate of performance improvement. Providers that can easily raise prices face far less financial pressure for restructuring activity. In contrast, local insurance markets consisting of strong plans that are also committed to payment innovation will reinforce the financial incentives created by the HHS programs. Finally, aggressive state policy can critically affect observed rates of spending growth and changes in quality. We believe it is critical that program evaluators be cognizant of the impact of state health insurance exchanges. States that enroll large populations of both subsidized and commercial enrollees and that direct their exchanges to take aggressive positions on limiting growth in health insurance premiums will substantially affect the incentives that flow through to the delivery system.
4.5 DATA SOURCES
The organizational variables listed in Exhibit 4-2 can be generated from a variety of sources. In this section, we describe several ways in which these variables can be populated, discussing the pros and cons of each method. In Exhibit 4-5, we match each variable to the most likely source. 1
Publicly Available Datasets: Several existing public databases already contain aspects of the variables listed in Exhibit 4-2. These data are economical because they have already been collected, cleaned, and (often) vetted. AHRQ’s Nationwide Inpatient Sample, for example, includes information on hospital payer mix, patient demographics, and hospital characteristics, such as ownership size and teaching status. The 2009 survey includes 1,050 hospitals from 44 States. AHRQ’s Healthcare Cost and Utilization Project (HCUP) maintains similar surveys of emergency rooms and ambulatory surgical centers.
However, most public data sets are focused on specific categories of providers and do not contain information about organizations that offer or contract for a wide range of services across the continuum of care. For example, the AHRQ’s Medical Expenditure Panel Survey (MEPS) may have information about certain healthcare organizations, including hospitals, office-based providers, home-care providers, pharmacies, and other caregivers. The MEPS Medical Provider Component, which helps estimate the exact cost of care, includes questions about the index patient’s insurance and the use of capitation, but it is unlikely to have a large enough sample in any given provider group to allow CMS to draw conclusions. Similarly, CMS Hospital Compare provides information on hospitals’ process of care, outcomes of care for select conditions (e.g., heart attacks, pneumonia), readmission rates, patient safety measures, and patients’ perceptions of care. In the process, these institutions are required to maintain a patient registry for these conditions. However, these data are collected for Medicare patients only and some variables are available only for hospitals that have submitted this information voluntarily.
Private Datasets: Data for several variables in Exhibit 4-2 can be found in private datasets. The American Hospital Association’s (AHA’s) annual survey of hospitals provides information on size and type of facilities. HealthLeaders-Interstudy provides managed care penetration at the state and local level. The American Medical Group Association and Council for Accountable Physician Practices regularly survey their members on aspects of care coordination and market influences. These data sets vary considerably in their scope, cost, and availability to outside researchers. We know of no data sets that provide comprehensive information about organizations that offer or contract for a wide range of services across the continuum of care.
Data Collected for Other Federal and State Programs: Beyond the data collected for individual program evaluations, the Federal Government collects information in conjunction for accreditation and evaluation of other programs. In addition, individual states also systematically register providers, facilities, and other groups (a complete list of state resources is beyond the scope of this project). These have a strong advantage in that providers are often required by law to comply and thus are comprehensive of all health care groups. It is unknown how readily researchers could access these data for purposes beyond its original charter. We highlight two programs here that are especially relevant to the variables in Exhibit 2:
- EHR Incentive Program: As a consequence for meaningful use requirements, CMS has annual data on the implementation and functionality of electronic health records within physician offices and hospitals. For example, to be certified as a system, the program requires these providers to meet goals of health information technology systems in terms of data recording (e.g., active medications, height/weight, automated order-entry, patient problem lists), preliminary decision support (e.g, formulary drug checks), and communications (e.g., electronic summaries to patients, summary care record to other providers, immunization summaries to public health agencies). Many of the specific requirements are similar to variables listed in the Information Technology and Data Management variable subgroup.
- NCQA Patient Centered Medical Home (PCMH) Survey and Accreditation: The PCMH survey queries provider groups on a host of issues similar to those in Exhibit 4-2. These include: use of data for population management, ability to identify high-risk patients, coordination with facilities and care transitions, implementing/demonstrating continuous quality improvement, measuring/reporting physician performance, and use of certified EHR technology.
Claims: Medicare claims data can be used to help determine patient characteristics and initial health status. Medicare claims are received from specific types of providers and do not contain information about provider affiliation (e.g., provider identifiers for all physicians and facilities associated with a single organization). In fact, no such database of provider affiliations exists, although CMS will likely compile such information for applicants or participants in its various delivery reform programs. This may be helpful in linking outcomes to organizations but will provide only limited information about organizational characteristics.
Organizational Surveys: Organizational surveys have the benefit of allowing researchers to craft specific items to answer the questions at hand. Often, these surveys can be self- or electronically-administered, greatly reducing the cost and personnel involved in data collection. Common questionnaires can be standardized across provider groups, allowing for precise comparisons across organizations on an exact set of responses. Standardization, however, also creates an important drawback for surveys because they may not be adaptable to certain settings or changes in settings over time. Generating a common survey instrument may require over-generalizing constructs so that they are appropriate for multiple types of organizations, potentially missing key variables or context that are most relevant for any given group. Finally, surveys require the researchers to garner sufficient response rates—a task that can demand significant time and resources.
- Executive-level surveys: For many variables, questions can be targeted to senior or executive leadership. Indeed, for questions regarding insurer contracts or market share, only senior-level executives will have that information. Executive-level surveys greatly speed and simplify data collection efforts, allowing for relatively small sets of questionnaires to represent a very large organization. While this makes survey administration more economical, these surveys also encompass several sources of bias. For instance, senior leaders or organizations working with CMS may answer questions that put them in a favorable light (self-response bias). Additionally, the persons who answer the survey are being asked to represent the entire organization, which may not always be accurate (responder bias). Follow-up interviews with executives can help researchers better understand the magnitude of some of these biases, as well as create a venue to explore the context of individual organizations. But such methods increase on the cost and time to complete the data collection.
- Employee-level surveys: For some organizational variables, especially culture and leadership domains, single- or small-group responses will not provide adequate information. For example, the Competing Values Framework requires multiple respondents at each organization to respond—a methodology that may be difficult to implement systematically across CMS programs. These large-scale employment surveys are significantly more expensive and time-consuming to administer.
Qualitative Research, Case Studies, and Ethnographies: Indepth, qualitative research has the advantage of providing a holistic examination of the complex mix of factors that promote successful implementation of HHS initiatives. It allows for a more nuanced approach, allowing for contextual factors to emanate organically without being influenced by rigidly defined, standardized variables. However, these methods are expensive and time-consuming, especially in terms of personnel costs. Researcher bias cannot be avoided, and the results are difficult to replicate. Further, qualitative research, without p-values and rigorous methodologies, may not be convincing to quantitative researchers or organizations like the Congressional Budget Office that are responsible for scoring the impact of program initiatives.
Other Sources: Some of the variables in Exhibit 4-2 cannot be fully determined from the categories listed above. Most prominently, the subcategory of Patient Centeredness can only be approximated through surveys or interviews of the organization’s employees. Researchers who truly want to measure this concept would also want to conduct patient surveys about their use of shared-decisionmaking, open-scheduling, and electronic access to communications and EHRs. Additionally, the data sources for many of the variables in the subcategory of Local Market Characteristics and State Policy Environment do not exist yet. New research may be required to understand how state goals and local community groups aid or hinder in the implementation of HHS initiatives.
4.6 ORGANIZATIONAL VARIABLES: RESEARCH AND DATA GAPS
The variables, rationale, and data sources in this chapter provide our assessment of existing research and of the opportunity for developing organizational variables likely to be associated with performance for providers participating in the new HHS delivery reform initiatives. However, the overarching goal of this project is larger than the research that we have used to develop our recommendations. This section briefly explores critical gaps in the research and data regarding organizational variables and their relationship to organizational performance.
Lack of Empirical Research Linking Organizational Variables to Performance. The principal objective of HHS delivery reform initiatives is to improve health care system performance on the three-part aim: individual health care, population health, and health care spending (Berwick, Nolan, and Whittington, 2008). However, the literature lacks systematic evaluation of the empirical relationship between organizational variables and performance on broad measures of the triple aim. There is a broad literature examining the impact of discrete interventions in discrete settings on particular outcome measures. But this literature does not translate well to the broad organizational performance improvements envisioned by the ACA. New HHS programs like the Pioneer ACO program, however, will provide rich new opportunities for analyzing these relationships in greater detail.
A broader concept of organizational characteristics thought to be associated with broader measures of performance is that of clinical integration, defined as:..the coordination of health services across providers, functions, activities, processes and settings in order to achieve maximal value for person for whom the system has assumed responsibility. (Conrad and Shortell, 1996). Clinical integration and care coordination are central to many individual HHS programs. Measures of clinical integration exist (e.g., Gilles et al., 1996) but they have not been tested widely across a range of organizations nor have they been empirically tied to outcomes.
Accommodating Variation in Types of Organizations: CMS initiatives within the ACA affect many different types of organizations, including hospitals, integrated delivery systems, organized physician groups, solo practitioners, and even some state agencies. A myriad of hybrid combinations of these organizations exists: a hospital with integrated post-acute care facilities, physician practices with home-health partnerships, etc. In many cases, it may be challenging to fit idiosyncratic health care organizations into common definitions and to craft a single survey or set of questions that are appropriate for all sites.
Data Availability: Academic researchers have the freedom to choose research questions for which there are strong, unassailable data to help answer them. Hence, the literature has many more studies on hospital dynamics for which there are good data than on other venues of health care, such as outpatient, post-acute, and the physician sector.
Similarly, there are limited measures of the internal dynamics of health care organizations. Structure does not always equal function; medical groups may compensate physicians with a salary, but this does not guarantee that they have the incentive to change their practice patterns. More research is needed to explore the culture, leadership, and relational coordination among members of a health care organization. And it may require significant resources to fully understand these dynamics.
Lastly, more research will be needed on the impact of external forces in driving successful implementation efforts, in particular, how the actions of private insurers, state policies, and community groups affect organizational behavior and performance.
Gathering Data on Comparison Groups: To accurately evaluate delivery reform initiatives, researchers may need health care data on groups who chose not to participate. Gaining access to health outcomes may be difficult, but this may be more of a challenge for the organizational and managerial variables. Many of the data sources mentioned in this chapter focus attention only on participating groups through surveys or qualitative case studies and interviews. While non-participating organizations could also be surveyed, determining the right control group and inducing their (even limited) participation may be challenging.
1. General Organizational Structure & Service Capacity (10)
Variable, Definition
Example
1. Type of Organization: General definition of the organization (e.g., integrated delivery system, hospital, multispecialty medical group, single-specialty medical group etc.)
[CTS Survey of Physicians] Please check the box that best describes where you work: a solo practice; a two-physician practice; a group practice with three or more physicians; a group or staff model HMO; a community health center; a hospital run by state, county, or city government; a hospital run by a private for-profit or non-profit organization; a medical school or university; some other setting.
2. Organizational Experience/History: How long has the organization been in existence; previous experience with payment reform
[NSPO I] How long has the oldest practice unit, which is now all or part of your group, been in existence?
3. Location: General location of the facilities (inner city, urban, suburban, rural)
[NSPO I] Which designation best describes the metropolitan area or communication surrounding the largest or primary location of your practice: central city, urban, suburban, small city, rural?
4. Control of Continuum of Care: Extent to which the organization owns or partners with other types of care delivery sites (e.g., hospital, specialty physician groups, skilled nursing facilities, ambulatory surgical centers, post-acute care facilities, rehabilitation facilities, other)
[Brandeis CAPP] Does your medical group own or operate any of the following entities: acute care hospital, skilled nursing facility, ambulatory surgery center, home health (please provide number of each and number of beds where applicable)?
5. Integration with Third-Party Payer Whether the organization has an owned or affiliated insurance plan.
[Brandeis CAPP] What proportion of your organization’s total patient revenue is paid by an owned or affiliated insurance plan?
6. Size - Number of Physicians: Number of FTE physicians, by type (e.g., primary care, specialist, hospitalist)
[NSPO III] Approximately how many of the physicians in your medical group, across all its locations, are: family physicians, general internists, general practitioners, cardiologists, endocrinologists, other.
7. Size - Number of Other Clinicians: Number of all FTE non-physician clinical staff, including nurses, nurse practitioners, and physician assistants, but may also include dieticians, health educators, and other providers.
[NSPO I] Please indicate the total number of the following health professionals (full or part-time) working in your medical group across all locations: nurses, nurse practitioners, physician assistants.
8. Size - Utilization: Estimation of annual volume based on the number of units of medical services (e.g., inpatient admissions, patient visits, etc.)
[AHA Survey] Report the number of inpatient admissions, inpatient days, outpatient visits.
1. General Organizational Structure & Service Capacity (10) (continued)
Variable, Definition
Example
9. Physician Affiliation Model: Percent of physicians who are employed, formally contracted, informally affiliated
[AHA Survey] Report the number of physicians with privileges at your hospital by: total employed, total individual contract, total group contract, not under contract.
10. Physician Compensation Model: Percent of employed/non-employed physician compensation that is salary, production-based (i.e., RVU), or performance-based
[Brandeis-CAPP] For [employed, non-employed] [primary care/specialist] physicians, what percent of compensation is based on the following factors: salary, production, efficiency/resource use, quality metrics, patient satisfaction, other?
2. Governance Structure
Variable, Definition
Example
1. Ownership/Organization: Entity or group that controls the policies and/or strategies of the organization, including for profit vs. not-for-profit status
[AHA Survey] Control – Indicate the type of organization that is responsible for establishing policy for overall operation of your hospital: Federal Government; government nonfederal (state, county, city, hospital district); nongovernment not-for-profit (church-operated, other not-for-profit); investor-owned for profit (individual, partnership, corporation).
[AMGA Survey] What is the legal organization of your medical group: business corporation, professional corporation, general partnership, limited liability partnership, not-for-profit corporation or foundation?
2. Board Members & Board Representation: What kinds of personnel make up the board, including physicians, other healthcare organizations, insurers, and consumers?
[NSPO I]: For the governing body of your medical group (NOT the owner of your practice, i.e. hospital or health system), please indicate: the total number of board positions, the number of [primary care/specialist] physicians on board, the number of meetings per year.
3. Financial, Payer and Reimbursement Model Characteristics (6)
Variable, Definition
Example
1. Size - Total Patient Services Revenue: Financial size of the organization in terms of patient revenue. Also may include profitability or operating margins in a defined fiscal period.
[AMGA Survey] What is your estimated annual medical net revenue? (later asks groups to calculate an organizational profit/loss statement)
[Brandeis-CAPP] Please estimate your total Net Patient Service Revenue based on the medical budget for designated physician group.
2. Market Share: Percent of care delivered (e.g., hospital beds/services, professional services) in organization’s primary service area
[Brandeis-CAPP] What is the organization’s market share in its primary service area for: professional services, hospital services?
3. Payer Mix: Percentage of the organization’s revenue from government payers, private insurance, and owned-affiliated insurers
[AHA Survey] Report the total facility gross and net revenue by: Medicare FFS, Medicare managed care, Medicaid FFS, Medicaid managed care, Medicaid DSH, other government, self-pay, third-party payers, all other
4. Payer Contracts/Reimbursement Mechanisms: Percentage of reimbursement contracts based on fee-for-service, shared savings, capitation, or other risk-based payments
[Brandeis-CAPP] What percent of organization’s patient revenues paid under the following payment mechanisms: fee-for-service, pay-for-performance under FFS, episode payments, shared savings, partial capitation, global capitation, other.
5. Patient Mix: The sociodemographic and eligibility characteristics of the patients the organization treats, and may also include patients’ initial health status to the extent that it is a risk-adjustment (and not outcome of care).
[CTS Survey of Physicians] Approximately what percentage of your patients belong to the following groups: African-American or Black, Hispanic or Latino, Asian or Pacific Islander, Native American, or Alaska Native? What percentage of your patients do you have a hard time speaking with or understanding because you speak different languages?
6. Major Payers: Extent to which revenue is concentrated in a few health plans with the ability to materially affect financial incentives through alternative payment models.
[Brandeis-CAPP] Please list the three health insurance plans that account for the largest share of your patient service revenue and the approximate percentage for each plan.
4. Information Technology and Data Management (6)
Variable, Definition
Example
1. EHR Availability: Basic question regarding the presence of an electronic health record
[Brandeis-CAPP] Has your organization implemented a common electronic medical record? Fully/partially?
2. EHR Documentation/ Meaningful Use: Assess the level of documentation of patient data, especially as it applies to meaningful use statutes?
[Jha et al, EHR Survey] Does your hospital have a computerized system for: patient demographics, physician notes, nursing assessments, problem lists, medication lists, discharge summaries, advanced directives (i.e. DNR)?
3. EHR Order Entry/ Results Management: Assess the level of functionality of the electronic health record within the organization
[Jha et al, EHR Survey] Does your hospital have a computerized system for [computerized provider order entry/ results viewing] for: labs, radiology, diagnostic tests, consultant reports?
4. EHR Adoption: Assess the level of penetration within the organization of personnel who use electronic health records
[Brandeis-CAPP] What percentage of treating physicians uses your organization’s electronic medical record? Routinely order medications electronically? Routinely order lab or other tests electronically?
5. EHR Decision Support: Assess the sophistication of the organization’s electronic health record to provide quality care
[Jha et al, EHR Survey] Does your hospital have a computerized system for decision support, including clinical guidelines, clinical reminders, drug allergy alerts, drug-drug interaction alerts, drug-lab interaction alerts, drug dosing support?
6. Data Management Capabilities: The extent to which the organization has invested and developed data analytic capabilities, including disease registries and practice variation analyses.
[Brandeis-CAPP] Has your organization [fully, partially, or not] implemented: enterprise-wide data warehouse and analytic software, patient disease registries, practice variation analysis?
5. Clinical Process Improvement Capabilities (6)
Variable, Definition
Example
1. Management Methodology: To what extent (if any) does the organization have a central management method for process improvement (e.g., Lean, Six Sigma, TPS, plan-do-study-act)?
[Brandeis/CAPP] Has your organization implemented a defined management methodology for process improvement (e.g. lean manufacturing)? Which methodology does your organization use? Approximately what percent of [physician/non-physicians] are trained in the methodology? Have participated in a performance improvement event?
2. Electronic Access to Data to Coordinate Care: The extent to which a provider can electronically evaluate and coordinate care, either through the organization’s EHR or through partnerships with other providers
[NSPO III] Approximately what percentage, if any, of the physicians in your medical group have electronic access to [patients’ emergency room visits, discharge summaries, laboratory results, pharmacy records]?
3. Performance Feedback: The extent to which physicians are given feedback on the quality and cost of care they provide patients
[Brandeis/CAPP] Do you [measure, report] physician performance in the following areas: production, efficiency/resource use, quality metrics, patient satisfaction, other? How frequently do physicians receive performance feedback?
4. Care Coordination Staff: Does the organization invest specific resources in personnel who coordinate care, including primary care teams or care coordinators?
[NSPO III] Does your medical group have any non-physician staff, for example, nurses, dieticians, or health educators, who have time set aside to meet with and/or call patients to help educate them and manage their disease?
5. Care Transition Programs: The extent to which the organization has developed formal processes (either internally or with partners) to coordinate care between ambulatory, hospital, and post-acute facilities.
[NSPO III] Does your medical group participate in formal organized care transition program, which improves transitions of care from hospital discharge to home care, nursing home care, or follow-up with the patient’s primary care physician or specialist?
6. Care Improvement Programs: What is the extent to which the organization has implemented specific programs intended to address unnecessary spending.
[Brandeis/CAPP] To what extent is your organization working on [far along, getting started, planning, not considering] the following initiatives: a) reducing avoidable hospital admissions; b) reducing avoidable hospital readmissions; c) high-risk patient management programs; d) preferred relationships with efficient specialists, hospitals, post-acute care facilities; e) reducing variation for defined episodes of care; f) performance-based physician compensation; g) physician leadership training; h) regular physician peer-group meetings; i) pharmaceutical management.
6. Culture, Leadership, and Teamwork (8)
Variable, Definition
Example
1. Organizational Culture: Description what the organization and its managers value as a predictor of quality improvement implementation, employee and patient satisfaction, and team functioning. Often categorized into “team culture,” “hierarchical culture,” “entrepreneurial culture,” and “rational culture.”
[Competing Values Framework] My facility is a very dynamic and entrepreneurial place. People are willing to stick their necks out and take risks; My facility is a very formalized and structured place. Bureaucratic procedures generally govern what people do.
2. Leadership: Employee’s assessment of the behavior of the organization’s leaders, signaling institution’s true (versus nominally espoused) values, culture, and processes
[Learning Organization Survey] My managers encourage multiple points of view; My managers provide time, resources, and venues for identifying problems and organizational challenges.
3. Quality of Communication: Staff assessment of the frequency, timeliness, and accuracy of communication with key clinical and administrative staff.
[Relational Coordination Survey] How frequently do people in each of these groups communicate with you about [focal work process or client population]?
4. Shared Goals: Staff assessment of whether their goals are consistent with those of key clinical and administrative staff
[Relational Coordination Survey] Do people in these groups share your goals regarding [focal work process or client population]?
5. Shared Knowledge: Staff assessment of whether they receive sufficient information from key clinical and administrative staff to support effective work
[Relational Coordination Survey] Do people in these groups know about the work you do with [focal work process or client population]?
6. Safety Climate: The ability of the organization to encourage openness/psychological safety, learn from errors and near misses, and find time for reflection
[Learning Organization Survey] People in this unit are usually comfortable talking about problems and disagreements; Despite the workload, people in this unit find time to review how the work is going.
7. Concrete Learning Processes and Practices: The extent to which the organization invests processes and resources into creating a learning organization, including information collection, analysis, and education and training
[CTS Survey of Physicians] Does the hospital where most of your patients are treated have a system for reporting medical errors, in which the person reporting the error remains anonymous?
[Learning Organization Survey] This unit experiments frequently with new ways of working; This unit has a formal process for conducting and evaluating experiments or new ideas.
8. Employee Tenure/Turnover: The length of tenure (or frequency of turnover) in an organization increases (or exacerbates) the ability to retain strong organizational knowledge and infers a strong (or weak) work-environment and organizational culture
7. Patient Centeredness
Variable, Definition
Example
1. Patient Centered Medical Home: The extent to which the organization practices care according to the patient-centric tenets of the PCMH
[NSPO III] Has your medical group received recognition as a Patient-Centered Medical Home from the National Committee for Quality Assurances (NCQA)? What level of recognition have you received?
2. Patient Access to Medical Records: The extent to which patients can access or contribute to their medical record
[NSPO III] Does your medical group allow patients to [view, make changes to or update] their medical record online? Does your practice use the electronic medical record to provide patients with clinical summaries of each office visit?
3. Shared Decisionmaking: The extent to which the organization formally incorporates patient input into treatment decisions
4. Open Scheduling: The extent to which patients have access to make or edit appointments with the organization’s providers
[NSPO III] Approximately what percentage, if any, of physicians in your medical group use the “advanced access” or “open access” scheduling method in an effort to offer same-day appointments to virtually all who want to be seen, regardless of the reason for which they want to be seen?
5. Email/Extended Communication: Does the organization communicate with patients and other providers via email?
[DesRoches et al. EHR Survey] Please indicate how frequently you communicate by email with each of the following: patients about medical issues, other physicians in your practice about patient care, other staff in your practice about patient care, other physicians who are not in your practice about patient issues.
8. Local Market Characteristics and State Policy Environment (10)
Type of Variable
Variable examples (Sources)
1. Relative Health Care Spending (price-adjusted). Areas with relatively higher health spending may have more opportunity to reduce spending through effective delivery reforms.
Medicare spending per beneficiary (Dartmouth Atlas)
Average family health insurance premium (MEPS)
2. Provider Market Concentration. Provider concentration indicates the ability of providers to negotiate desired private sector price increases, thus lowering the relative incentives to reduce spending or modify historical service use patterns.
Herfindahl index for hospitals
3. Insurer Market Concentration. Insurer concentration indicates the ability of insurers to limit private sector price increases, thus increasing relative incentives to reduce spending or modify historical service use patterns (in ways that may affect patterns of care provided to Medicare and Medicaid patients)
Percentage of commercial enrollees in the three largest health insurance plans
4. Insurance Plan Type. Penetration of HMO/POS products is related to use of capitation and other alternative payment models as provider organizations are more willing to accept risk under benefit design that includes a requirement for referral authorization prior to specialty care
Percentage of total commercial enrollment in HMO/POS product
Percentage of total Medicare beneficiary in HMO product
Percentage of Medicaid beneficiaries in HMO product
5. Private Insurer Payment Innovation. Indication of the extent to which private insurers are implementing delivery reform initiatives that complement those of Medicare and Medicaid
What percentage of commercially insured enrollees is enrolled in performance-based reimbursement contracts? Note: there are no sources for this information on an area-specific basis at present.
6. Community Engagement. Extent to which there is local community organization across sectors to address causes and remedies of high healthcare spending and/or inadequate quality
Is there a local multi-stakeholder coalition/collaborative focused on controlling cost? Is there a local multi-stakeholder coalition/collaborative focused on improving quality?
8. Local Market Characteristics and State Policy Environment (10) (continued)
Type of Variable
Variable examples (Sources)
7. State Policy – Health Care Spending Goals. Indicates states willingness and capacity to address issues of total health care spending
Does the state measure overall state health care spending? Has the state established specific goals for annual growth in overall state health care spending? Does the state have a mechanism for enforcing specific goals for growth in overall health care spending?
8. State Policy – Health Insurance Exchange. Indication of the extent to which state is willing to use health insurance exchange authority to actively promote lower cost health insurance options. These efforts would likely prove complementary to HHS delivery system reform programs.
What proportion of local residents purchase health insurance coverage through an American Health Benefits Exchange?
Commercial members (individual)
Commercial enrollees (small group)
Commercial enrollees (large group)
9. State Policy – Health Regulation. Indication of the extent to which state has or is willing to use health insurance regulatory authority to actively promote lower cost health insurance options. These efforts would likely prove complementary to HHS delivery system reform programs.
Does the state review health insurance premiums?
Small group market
Large group market
Has the state set limits on annual growth in health insurance premiums?
10. State Policy: Transparency. Indicator of the extent to which the state is promoting public accountability and increased competition through publication of performance measures.
Does the state collect data on prices negotiated between private insurers and health care providers? Does the state publish data on prices negotiated between private insurers and health care providers?
[NSPO III] Are data on [patient satisfaction/ experience, clinical quality, cost] within your medical group or its physicians publicly reported by health plans or other external entities?
1. General Organizational Structure & Service Capacity
Variable, Definition
Rationale
1. Type of Organization: General definition of the organization (e.g., integrated delivery system, hospital, multispecialty medical group, single-specialty medical group, etc.)
Need for general classification of participating organizations
2. Organizational Experience/History: How long has the organization been in existence; previous experience with payment reform
3. Location: General location of the facilities (inner city, urban, suburban, rural)
Reflects general differences in spending levels and availability of services among urban, suburban and rural locations.
4. Control of Continuum of Care: Extent to which the organization owns or partners with other types of care delivery sites (e.g., hospital, specialty physician groups, skilled nursing facilities, ambulatory surgical centers, post-acute care facilities, rehabilitation facilities, other)
Reflects size and scale of organization and potential to integrate or coordinate services across owned or closely affiliated providers.
5. Integration with Third-Party Payer Whether the organization has an owned or affiliated insurance plan.
Reflects access to staff and infrastructure that can provide data analytic and actuarial services that can help organizations measure performance.
6. Size - Number of Physicians: Number of FTE physicians, by type (e.g., primary care, specialist, hospitalist)
Indicates scale and scope of organization, Scale can help implementation efforts by allowing investments in overhead resources in human and financial capital to be efficiently spread across the organization.
7. Size - Number of Other Clinicians: Number of all FTE non-physician clinical staff, including nurses, nurse practitioners, and physician assistants, but may also include dieticians, health educators, and other providers.
Indicates level of support available to physicians by skilled non-physician clinicians. May related to ability to care for populations more efficiently.
8. Size - Utilization: Estimation of annual volume based on the number of units of medical services (e.g., inpatient admissions, patient visits, etc.)
Indicates scale and scope of organization, Scale can help implementation efforts by allowing investments in overhead resources in human and financial capital to be efficiently spread across the organization.
9. Physician Affiliation Model: Percent of physicians who are employed, formally contracted, informally affiliated
Physician affiliation can be associated with acceptance of or alignment with performance improvement initiatives
10. Physician Compensation Model: Percent of employed/non-employed physician compensation that is salary, production-based (i.e., RVU), or performance-based
Indicates the extent to which physicians are compensated based on production or rewarded for objective measures of quality, efficiency or patient satisfaction
2. Governance Structure
Variable, Definition
Rationale
1. Ownership/Organization: Entity or group that controls the policies and/or strategies of the organization, including for profit vs. not-for-profit status
2. Board Members & Board Representation: What kinds of individuals make up the board? Are physicians and patients represented? Are participants from across the continuum of care represented?
Broad representation of constituents in governance may reflect willingness to focus on aligning services across the continuum of care and embracing patient-centered reform initiatives.
3. Financial, Payer and Reimbursement Model Characteristics
Variable, Definition
Rationale
1. Size - Total Patient Services Revenue: Financial size of the organization in terms of patient revenue. Also may include profitability or operating margins in a defined fiscal period.
Indicates scale and scope of organization, Scale can help implementation efforts by allowing investments in overhead resources in human and financial capital to be efficiently spread across the organization.
2. Market Share: Percent of care delivered (e.g., hospital beds/services, professional services) in organization’s primary service area
3. Payer Mix: Percentage of the organization’s revenue from government payers, private insurance, and owned-affiliated insurers
Percent of revenue from government payers may indicate importance for the organization of success in new delivery reform programs.
4. Payer Contracts/Reimbursement Mechanisms: Percentage of reimbursement contracts based on fee-for-service, shared savings, capitation, or other risk-based payments
Historical experience with capitation or other risk-based payment models may indicates greater preparedness for CMS performance-based payment models.
The extent that revenue is tied to performance on health care spending may indicate ability to perform successfully in HHS delivery reform programs.
5. Patient Mix: The sociodemographic and eligibility characteristics of the patients the organization treats, and may also include patients’ initial health status to the extent that it is a risk-adjustment (and not outcome of care).
Changes in patient mix will affect performance on spending and quality outcomes.
6. Major Payers: Extent to which revenue is concentrated in a few health plans with the ability to materially affect financial incentives through alternative payment models.
4. Information Technology and Data Management
Variable, Definition
Rationale
1. EHR Availability: Basic question regarding the presence of an electronic health record
Availability of a shared EHR platform can help organizations coordinate care across providers
2. EHR Documentation/ Meaningful Use: Assess the level of documentation of patient data, especially as it applies to meaningful use statutes
Measure of functionality of the electronic health record
3. EHR Order Entry/ Results Management: Assess the level of functionality of the electronic health record within the organization
Measure of functionality of the electronic health record
4. EHR Adoption: Assess the level of penetration within the organization of personnel who use the electronic health record’s capabilities.
Degree of penetration of EHR use in the organization provides an indication of clinical integration which may be associated with ability to improve performance
5. EHR Decision Support: Assess the sophistication of the organization’s electronic health record to provide quality care.
Automated decision support can reduce unnecessary variance in care delivery.
6. Data Management Capabilities: The extent to which the organization has invested and developed data analytic capabilities, including disease registries and practice variation analyses
Organizations with ability to measure and analyze their own performance may be more likely to succeed in performance improvement.
5. Clinical Process Improvement Capabilities (6)
Variable, Definition
Rationale
1. Management Methodology: To what extent (if any) does the organization have a central management method for process improvement (e.g., Lean, Six Sigma, TPS, plan-do-study-act)?
Indication of degree of commitment to a formal method for performance improvement
2. Electronic Access to Data to Coordinate Care: The extent to which a provider can electronically evaluate and coordinate care, either through the organization’s EHR or through partnerships with other providers
Indicative of clinical integration across the continuum of care that may improve capacity to improve performance
3. Performance Feedback: The extent to which physicians are given feedback on the quality and cost of care they provide patients
Indicative of clinical integration across the continuum of care that may improve capacity to improve performance
4. Care Coordination Staff: Does the organization invest specific resources in personnel who coordinate care, including primary care teams or care coordinators?
Indicative of clinical integration across the continuum of care that may improve capacity to improve performance
5. Care Transition Programs: The extent to which the organization has developed formal processes (either internally or with partners) to coordinate care between ambulatory, hospital, and post-acute facilities.
Indicative of clinical integration across the continuum of care that may improve capacity to improve performance
6. Care Improvement Programs: Extent to which the organization has implemented specific programs intended to address unnecessary spending.
Indicative of clinical integration across the continuum of care that may improve capacity to improve performance
6. Culture, Leadership, and Teamwork
Variable, Definition
Rationale
1. Organizational Culture: Description of what the organization and its managers value as a predictor of quality improvement implementation, employee and patient satisfaction, and team functioning. Often categorized into “team culture,” “hierarchical culture,” “entrepreneurial culture,” and “rational culture.”
Strong organizational culture, history, and mission focuses thinking, shared ethics, and purpose.
2. Leadership: Employee’s assessment of the behavior of the organization’s leaders, signaling institution’s true (versus nominally espoused) values, culture, and processes.
Willingness to embark on performance improvement initiatives and ability to implement them successfully is enhanced by strong physician leadership, robust management structure, and clear reporting lines of communication.
3. Quality of Communication: Staff assessment of the frequency, timeliness, and accuracy of communication with key clinical and administrative staff
Indication of the ability of team members to work together and effectively implement new initiatives
4. Shared Goals: Staff assessment of whether their goals are consistent with those of key clinical and administrative staff
Indication of the ability of team members to work together and effectively implement new initiatives
5. Shared Knowledge: Staff assessment of whether they receive sufficient information from key clinical and administrative staff to support efficient, effective completion of their work.
Indication of the ability of team members to work together and effectively implement new initiatives
6. Safety Climate: The ability of the organization to encourage openness/psychological safety, learn from errors and near misses, and find time to reflection.
Indication of organization’s emphasis on a culture of improvement over a culture of blame
7. Concrete Learning Processes and Practices: The extent to which the organization invests processes and resources into creating a learning organization, including information collection, analysis, and education and training
Indication of organization’s commitment to ongoing positive change and to support employees in effecting this change
8. Employee Tenure/Turnover: The length of tenure (or frequency of turnover) in an organization
The rate of turnover increases (or exacerbates) the ability to retain strong organizational knowledge and infers a strong (or weak) work-environment and organizational culture
7. Patient-Centeredness
Variable, Definition
Rationale
1. Patient Centered Medical Home: The extent to which the organization practices care according to the patient-centric tenets of the PCMH
Goals and objectives of patient-centered medical home are fundamentally based on the three-part-aim and therefore fully consistent with HHS delivery reform efforts
2. Patient Access to Medical Records: The extent to which patients can access or contribute to their medical record
Indication of organizational commitment to patient-centeredness
3. Shared Decisionmaking: The extent to which the organization formally incorporates patient input into treatment decisions
Indication of organizational commitment to patient-centeredness
4. Open Scheduling: The extent to which patients have access to make or edit appointments with the organization’s providers
Indication of organizational commitment to patient-centeredness
5. Email/Extended Communication: Does the organization communicate with patients and other providers via email?
Indication of organizational commitment to patient-centeredness
8. Local Market Characteristics and State Policy Environment (10)
Type of Variable
Rationale
1. Relative Health Care Spending (Price-Adjusted)
Areas with relatively higher health spending may have more opportunity to reduce spending through effective delivery reforms.
Local market conditions (relative health care costs, market concentration) can reduce or encourage willingness and attention on reform initiatives.
Private insurer contracts and state/local efforts with health care groups can augment the intentions of CMS to help drive organizational change.
2. Provider Market Concentration
May indicates the ability of providers to negotiate desired private sector price increases thus lowering the relative incentives to reduce spending or modify historical service use patterns.
3. Insurer Market Concentration
May indicate the ability of insurers to limit private sector price increases thus increasing the relative incentives to reduce spending or modify historical service use patterns (in ways that may affect patterns of care provided to Medicare and Medicaid patients).
8. Local Market Characteristics and State Policy Environment (10) (continued)
Type of Variable
Rationale
4. Insurance Plan Type. Penetration of HMO/POS products.
May be related to use of capitation and other alternative payment models or potential for expansion of these models, as provider organizations are more willing to accept risk under benefit design that includes a requirement for referral authorization prior to specialty care.
5. Private Insurer Payment Innovation
Indication of the extent to which private insurers are implementing delivery reform initiatives that complement those of Medicare and Medicaid.
6. Community Engagement
Extent to which there is local community organization across sectors to address causes and remedies of high healthcare spending and/or inadequate quality.
7. State Policy—Health Care Spending Goals
Indicates states willingness and capacity to address issues of total health care spending
7. State Policy—Health Insurance Exchange
Indication of the extent to which state is willing to use health insurance exchange authority to actively promote lower cost health insurance options. These efforts would likely prove complementary to HHS delivery system reform programs.
8. State Policy—Health Regulation
Indication of the extent to which state has or is willing to use health insurance regulatory authority to actively promote lower cost health insurance options. These efforts would likely prove complementary to HHS delivery system reform programs.
9. State Policy—Transparency
Indicator of the extent to which the state is promoting public accountability and increased competition through publication of performance measures.
1. General Organizational Structure & Service Capacity
Variable
Pros
Cons
1. Type of Organization
Classification of organizations is needed
Significant variability in organization characteristics within classifications
2. Organizational Experience
May be indicative of organizational stability, development of systems, and presence of common culture in integrated organizations (e.g.multi-specialty groups)
Probably less relevant for individual institutions (e.g., hospitals, nursing homes); may only be a proxy for other variables.
3. Location
Readily available, may have specific policy implications for rural facilities
4. Control of Continuum Of Care
Important variables for understanding integration
Easy to validate
Often unavailable in public databases and will require survey of organizations; may change over time
5. Integration With Third-Party Payer
Good indicator of access to data analytic and actuarial resources
Relatively few organizations are presently integrated with third party payer
6. Size - Number of Physicians
Necessary variable for size/scale
Requires survey of organization
7. Size - Number of Other Clinicians
Indication of extent that physicians are leveraged with extenders
Requires survey of organization
8. Size - Utilization
Necessary variable for size/scale
Requires survey of organization
9. Physician Affiliation Model
Important measure of integration
Requires survey of organization
10. Physician Compensation Model
Important measure of financial incentives faced by individual physicians
Requires survey of organization
2. Governance Structure (2)
Variable
Pros
Cons
1. Ownership/Organization
Frequently used as a control variable in analysis of healthcare facility costs
Publically available for certain organizations (e.g. facilities) but may require survey for others (e.g. physician groups)
2. Board Composition
Indication that key stakeholders are involved in organizational decisionmaking
Requires survey of organization
3. Financial, Payer and Reimbursement Model Characteristics (5)
Variable
Pros
Cons
1. Size - Total Patient Services Revenue
Necessary variable for size/scale
Readily available for certain delivery system elements (e.g., hospitals) but may require survey for other elements (e.g. physician groups)
2. Market Share
Indicator of organization’s ability to dictate terms to suppliers and purchasers
May be either positively or negatively correlated with performance improvement
3. Payer Mix
Indicates proportion of organization’s revenue dedicated to public vs. private payers, proportion that may be risk-based
Does not provide specific details of the contracts or their financial incentives for coordinated care
4. Payer Contracts/Reimbursement Mechanisms
Indicates organization’s experience and current use of performance based contracts
Requires survey of organization
Contracting organizations (i.e., PHOs, IPAs) will be able to report on contracts that it manages but will not have information on all sources of revenue for contracted physicians and other components of the contracted network
5. Patient Mix
CMS has ready access to information about Medicare beneficiary characteristics
Spending levels and other performance measures vary based on patient characteristics
6. Major payers
Could provide indication of potential for expansion of private sector performance based contracts
Requires additional information about initiatives underway at local private payers
4. Information Technology and Data Management
Variable
Pros
Cons
1. EHR Availability
Precursor to EHR adoption
Does not provide insight into how EHR is used
2. EHR Adoption
Strong gauge of potential of organization to take advantage of performance improvement facilitated by EHR
Does not provide insight into how EHR is used
3. EHR Documentation/ Meaningful Use
Availability of documented measures
Documented measures will not include full range of EHR capabilities of interest
4. EHR Order Entry/ Results Management
Specific EHR capabilities may be associated with performance
Does not provide insight into extent specific EHR capability is used
5. EHR Decision Support
EHR decision support is very likely associated with performance
Does not provide insight into extent specific EHR capability is used
6. Data Management Capabilities
Essential capacity for monitoring and improving performance
Does not provide insight into quality of data analysis and reporting within the organization or use of reporting by managers and clinicians
5. Clinical Process Improvement Capabilities (6)
Variable
Pros
Cons
1. Management Methodology
Indication of degree of commitment performance improvement.
Process measure. Difficult to quantify the extent to which the methodology is applied or its effectiveness. Requires survey to collect information.
2. Electronic Access to Data to Coordinate Care
Indicative of clinical integration across the continuum of care that may improve capacity to improve performance.
Process measure. Difficult to quantify the extent to which the data are used or their effectiveness. Requires survey to collect information.
3. Performance Feedback
Indicative of clinical integration that may improve capacity to improve performance.
Process measure. Difficult to quantify the extent to which the data are used or their effectiveness. Requires survey to collect information.
4. Care Coordination Staff
Indicative of clinical integration across the continuum of care that may improve capacity to improve performance
Process measure. Difficult to quantify the effectiveness of these staff or extent of their activities. Requires survey to collect information.
5. Care Transition Programs
Indicative of clinical integration across the continuum of care that may improve capacity to improve performance
Process measure. Difficult to quantify the effectiveness of these programs or extent of their activities. Requires survey to collect information.
6. Care Improvement Programs
Indicative of clinical integration that may improve capacity to improve performance
Process measure. Difficult to quantify the effectiveness of these programs or extent of their activities. Requires survey to collect information.
6. Culture, Leadership, and Teamwork
Variable
Pros
Cons
1. Organizational Culture
Essential element of performance
Difficult to measure accurately. Requires substantial investment in physician and employee surveys.
2. Employee Turnover
Documents consistency of personnel, allowing for retained organizational knowledge
Difficult to measure, requiring historical analysis of human resources/employee survey
3. Leadership
Essential element of performance
Difficult to measure accurately. Requires substantial investment in physician and employee surveys.
4. Quality of Communication
Essential element of performance
Difficult to measure accurately. Requires substantial investment in physician and employee surveys.
5. Shared Goals
Essential element of performance
Difficult to measure accurately. Requires substantial investment in physician and employee surveys.
6. Shared Knowledge
Essential element of performance
Difficult to measure accurately. Requires substantial investment in physician and employee surveys.
7. Safety Climate
Essential element of performance
Difficult to measure accurately. Requires substantial investment in physician and employee surveys.
8. Concrete Learning Processes and Practices
Essential element of performance
Difficult to measure accurately. Requires substantial investment in physician and employee surveys.
7. Patient Centeredness
Variable
Pros
Cons
1. Patient Centered Medical Home
Consistent with the 3-part aim
Certification data available from NCQA
Difficult to evaluate the scope or quality of PCMH programs without qualitative assessment.
2. Patient Access to Medical Records
Indication of organizational commitment to patient-centeredness
Process measure. Impact on outcomes in not known.
3. Shared-decision making
Indication of organizational commitment to patient-centeredness
Difficult to evaluate the scope or quality of shared decision making initiatives without qualitative assessment.
4. Open Scheduling
Indication of organizational commitment to patient-centeredness
Process measure. Impact on outcomes in not known.
5. Email/Extended Communication
Indication of organizational commitment to patient-centeredness
Process measure. Impact on outcomes in not known.
8. Local Market Characteristics and State Policy Environment
Type of Variable
Pros
Cons
1. Relative Health Care Spending (Price-Adjusted)
Easily available– Dartmouth Atlas or Medicare claims data
2. Provider Market Concentration
Easy to measure for hospital inpatient services and certain other institutional services
Much more difficult to measure for physician services
3. Insurer Market Concentration
Easy to measure from publicly available sources
4. Insurance Plan Type
Data are available from private services like Interstudy
Possibly less valuable as an indicator with growth of shared savings payment models that do not require HMO-type benefit design.
5. Private Insurer Payment Innovation.
Important indicator of private sector payment incentives for performance improvement
Requires detailed primary data collection through case study type approaches
Changing at rapid rate requiring annual updating
6. Community Engagement
Presence of regional health care collaboratives /community quality improvement initiatives (e.g. RWJF AF4Q) are readily available
Determining effectiveness of regional initiatives requires detailed research that is subjective in nature
7. State Policy – Health Care Spending Targets
Indicator of state government pressure on market participants to constrain costs
Only a few states currently contemplating such targets and fewer have determined enforcement mechanisms
8. State Policy – Health Insurance Exchange
Indicator of state willingness to utilize health insurance exchange authority to actively promote better functioning insurance markets
Many possible exchange configurations—would require qualitative assessment of potential for affecting health care quality and cost
9. State Policy – Health Insurance Regulation.
Indicator of state willingness to use health insurance regulatory authority to actively promote lower cost health insurance options
Would require some qualitative assessment of potential for affecting health care quality and cost
10. State Policy: Transparency
Indicator of state willingness to publish health care provider prices and quality measures in order to create stronger impetus for performance improvement
Would require some qualitative assessment of the extent of transparency created and potential for affecting health care quality and cost
Publicly-Available Data
Privately-Held Datasets
Data from Fed/State Programs
Medicare Claims
Exec-Level Org Surveys
Employee Level Org Surveys
Qual/ Case Studies/ Ethnog.
Comment
1. General Organizational Structure & Service Capacity
1. Type of Organization
